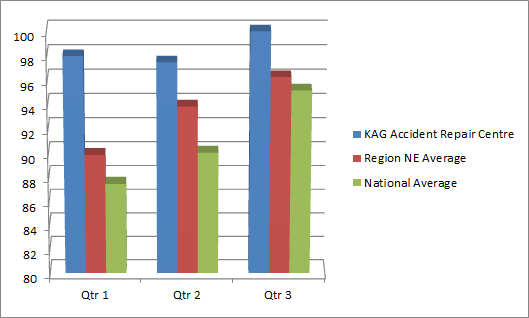
Customer Satisfaction Survey Results Dec 11 – Mar 12
| Qtr 1 | Qtr 2 | Qtr 3 | |
| KAG Accident Repair Centre | 98 | 97.5 | 100 |
| Region NE Average | 89.9 | 93.9 | 96.3 |
| National Average | 87.5 | 90.1 | 95.2 |

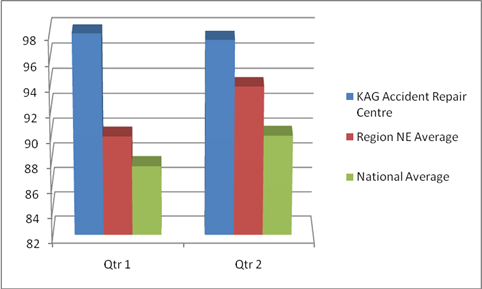
Key Work Provider Customer Satisfaction Survey Results Dec 10 – Mar 11
Our service levels are regularly monitored by our work providers & insurers. The following survey results illustrate how our performance was rated over the previous two quarters by one of our key clients.
The surveys asked policyholders to rate our service out of 10 in five key areas:
- If a courtesy car was offered and supplied
- If they were offered a collection and delivery service
- If they received regular updates on progress of their repairs
- If they were happy with the standard of repairs
- If they were happy with the service they received overall
The table shows our results out of a possible score of 100 in comparison to our regions average and the national average.
|
Qtr 1 |
Qtr 2 |
|
|
KAG Accident Repair Centre |
98 |
97.5 |
|
Region NE Average |
89.92 |
93.86 |
|
National Average |
87.54 |
89.98 |


